24 Powerful Candlestick Patterns PDF Guide
Candlestick patterns are powerful tools in a trader’s arsenal, providing valuable insights into market sentiment and potential price movements. In this article, we will explaining in details 24 candlestick patterns that can help traders make more informed decisions.
Candlestick patterns have been used for centuries to analyze price movements and forecast market trends. They offer a visual representation of market data, making it easier for traders to spot potential reversals, continuations, and indecision points. Whether you’re a novice or an experienced trader, understanding these patterns can significantly improve your trading strategy.
[ez-toc]
The Anatomy of a Candlestick
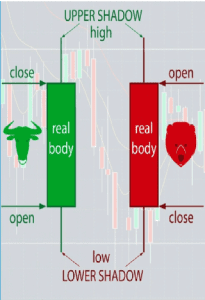
Imagine each candlestick as a tiny storyteller, revealing tales of price action. Revealing the tussle between sellers and buyers, showing the aggressiveness and momentum each party are approaching the market with. A single candlestick comprises four vital elements:
- Open Price (The Beginning): This is where the story starts. It’s the price at which the asset opened for that specific time period.
- Close Price (The Conclusion): The closing price is where the story ends, where the candlestick closes showing the final price at the end of the time period.
- High Price (The Climax): The highest point the price reached during that interval. This can be illustrated by the candlestick shadow or wick as indicated in the diagram above. It’s where excitement peaked.
- Low Price (The Trough): The lowest point the price reached, indicating the moment in which the bears or sellers were more aggressive in the market within the candlestick timeframe. It is also represented by the shadow or wick as illustrated in the diagram above.
Meaning of Candlestick Patterns
Candlestick patterns are combinations of one or more candlesticks that provide traders with significant information about price reversals, continuations, and indecision points. These patterns are represented graphically, creating different shapes and patterns, as you will see in the diagram below. Candlestick patterns can further be divided into three (3) types namely:
- Bullish candlestick patterns
- Bearish candlestick patterns
- Reversal candlestick patterns
Each and every one of these candlestick pattern types has various patterns associated with them and we will be examining about 24 basic candlestick patterns in this article while we categorize them into their types. You can also download the 24 powerful candlestick patterns PDF download file and read it offline as we have made the PDF file downloadable. Now let’s start examining the various candlestick patterns alongside their pictorial illustration.
Bullish Candlestick Patterns:
Bullish candlestick patterns are formations on a price chart that suggest a potential upward movement in the price of an asset. These patterns are often considered positive signals by traders, indicating a higher probability of an upward trend or bullish reversal. Bullish candlestick patterns typically occur after a downtrend or during a consolidation phase, signalling a shift in market sentiment favouring buyers.
Now in this candlestick patterns pdf guide, I will give you a list of the most common bullish candlestick patterns you would most likely always find in your day-to-day candlestick chart.
- Hammer
- Bullish Engulfing Pattern
- Morning Star
- Piercing Line
- Bullish Harami
- Bullish Spinning Top
- Bullish Marubozu
- Three Inside Up
Hammer:
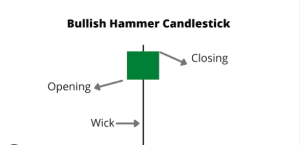
The Hammer is a single candlestick pattern that often signifies a significant shift in market sentiment and price direction. This pattern typically emerges after a preceding downtrend and offers traders valuable insights into a potential bullish reversal. Let’s dive into a more detailed explanation of the Hammer pattern:
Appearance and Components:
Real Body: The Hammer has a relatively small real body (the rectangular area between the open and close prices), which is usually at or near the high of the candle. The color of the real body can be either bullish (white or green) or bearish (black or red), although a bullish real body is more common for a Hammer.
Long Lower Shadow: The most distinctive feature of a Hammer is its long lower shadow, extending below the real body. This lower shadow represents the distance between the lowest price of the candle and the opening or closing price.
Interpretation and Significance:
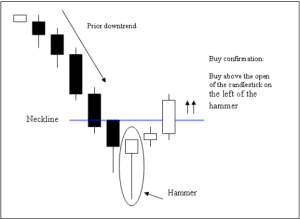
- The presence of a Hammer after a downtrend is a strong indication that bearish sentiment may be waning, and the potential for a bullish reversal exists. The reasoning behind this interpretation lies in the intraday price action.
- During a downtrend, the market opens and moves lower, reflecting persistent bearish pressure. However, as the trading session progresses, buyers step in and push the price up from the lows. This upward pressure causes the long lower shadow of the Hammer.
- The small real body near the high of the candle suggests that buyers have gained control and are attempting to reverse the trend. It represents a shift from the sellers dominating the market to a more balanced or bullish sentiment.
- The longer the lower shadow, the more significant the pattern is considered. If the lower shadow is exceptionally long, it signifies that buyers rejected lower prices emphatically and may foreshadow a more robust reversal.
Confirmation and Trading Strategy:
- To confirm the Hammer pattern and strengthen the signal of a potential bullish reversal, traders often look for a follow-up bullish candle on the next trading day.
- Entering a trade based on the Hammer pattern typically involves setting a stop order above the high of the Hammer candle, indicating a buy entry point if the price moves higher in the next session.
- Traders should also consider other technical indicators, such as trendlines, moving averages, and volume, to provide additional confirmation and context for their trading decisions.
Bullish Engulfing Pattern
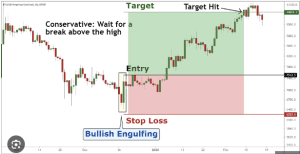
The Bullish Engulfing candlestick pattern is a highly regarded two-candlestick formation used in technical analysis to identify potential bullish trend reversals. This pattern is known for its strong signalling capability and provides traders with important insights into shifts in market sentiment.
Let’s delve into a more detailed explanation of the Bullish Engulfing pattern:
Components and Appearance:
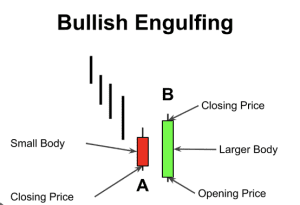
Two Candles: The Bullish Engulfing pattern consists of two distinct candles, each revealing crucial information about market dynamics.
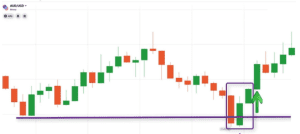
Bearish Candle: The pattern begins with a small bearish candle, characterized by a real body (the rectangular area between the open and close prices) that typically closes lower than it opens. This represents the initial dominance of sellers in the market.
Bullish Candle: The second candle in the pattern is a larger bullish candle with a real body that opens lower than the previous candle’s close (the bearish candle) and closes higher than the bearish candle’s open. Crucially, the bullish candle engulfs the entire range of the preceding bearish candle, including both the real body and the shadows (wicks).
Interpretation and Significance:
The Bullish Engulfing candlestick pattern is a potent signal of a possible shift from a bearish trend to a bullish one. It suggests a change in market sentiment and increased buying pressure.
The significance of this pattern is grounded in the notion that buyers have taken control of the market. While the first bearish candle indicates the presence of sellers, the subsequent bullish candle completely engulfs the bearish candle, reflecting a dramatic reversal of control.
The pattern indicates that buyers are not only countering the bearish pressure but also exerting dominance, leading to higher closing prices compared to the opening of the bearish candle.
The larger the second (bullish) candle compared to the first (bearish) candle, the more powerful and convincing the Bullish Engulfing pattern is considered.
Confirmation and Trading Strategy:
Traders typically seek confirmation of the Bullish Engulfing pattern by monitoring the subsequent price action. They look for further upward movement in the following candles, which strengthens the signal of a bullish reversal.
Entering a trade based on this pattern usually involves setting a buy order above the high of the bullish candle that formed the pattern. This strategy allows traders to participate in the potential bullish movement.
To enhance the accuracy of the signal, traders often consider other technical indicators, such as volume, trendlines, and support levels, to provide additional context and confirmation.
Morning Star:
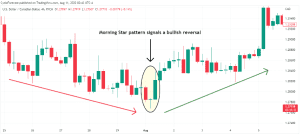
The Morning Star is a well-recognized and potent three-candlestick pattern used in technical analysis to identify potential bullish trend reversals. This pattern is often associated with strong signalling capabilities and provides traders with valuable insights into changing market dynamics. Let’s delve into a more comprehensive explanation of the Morning Star pattern:
Components and Appearance:
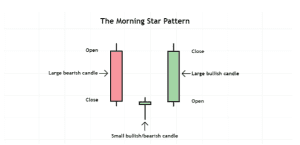
Three Candles: The Morning Star pattern consists of a sequence of three distinct candles, each carrying significant information about the market’s probable future direction.
Large Bearish Candle: The pattern commences with a large bearish (red or black) candle. This bearish candle signifies the existing bearish sentiment in the market. It typically closes considerably lower than its opening price.
Small Indecisive Candle: Following the bearish candle, there is a small candle with a real body that may be bullish or bearish, often referred to as a “doji” or “spinning top.” This candle is indicative of market indecision and a potential shift in sentiment.
Large Bullish Candle: The Morning Star pattern concludes with a large bullish (green or white) candle. This candle opens lower than the previous bearish candle’s close and proceeds to close significantly higher. The bullish candle represents a change in market sentiment and a shift toward bullish dominance.
Importantly, it engulfs the entire range of the preceding bearish candle, including both the real body and the shadows (wicks).
Interpretation and Significance:
The Morning Star pattern is a powerful indicator of a likely shift from a bearish trend to a bullish one. It signifies a reversal in market sentiment from pessimism to optimism.
The significance of this pattern lies in the transition from bearish to bullish control. The initial bearish candle reflects the dominance of sellers, but the following small, indecisive candle suggests a potential turning point. The final large bullish candle, which engulfs the bearish candle, reveals a change of guard with buyers taking control.
The pattern implies that buyers are not only counteracting the previous bearish pressure but also gaining ascendancy, leading to higher closing prices compared to the opening of the bearish candle.
The larger the bullish candle in relation to the bearish candle, the more compelling the Morning Star pattern is considered.
Piercing Line
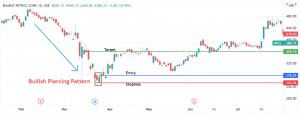
The Piercing Line is a notable candlestick pattern used in technical analysis to identify potential bullish trend reversals. It is a two-candle pattern with distinctive characteristics, often seen after a downtrend.
To gain a more comprehensive understanding of the Piercing Line pattern, let’s explore its components, interpretation, and trading significance in greater detail:
Components and Appearance:
Two Candles: The Piercing Line candlestick pattern consists of two individual candles, each providing essential insights into market sentiment.
Bearish Candle: The pattern starts with a bearish (red or black) candle, symbolizing the prevailing bearish pressure in the market. This candle typically opens at or near its high and closes lower, reflecting a downward momentum.
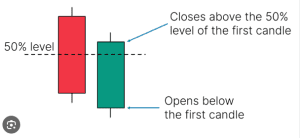
Bullish Candle: Following the bearish candle, the Piercing Line pattern features a bullish (green or white) candle. What sets this candle apart is its opening price, which is notably lower than the prior bearish candle’s closing price. This gap down signifies a lower opening due to the prior session’s bearish sentiment.
Price Penetration: The distinctive feature of the Piercing Line pattern is the penetration of the bearish candle’s real body by the bullish candle. The bullish candle’s closing price should be significantly higher than the previous bearish candle’s closing price, indicating a bullish reversal attempt.
Interpretation and Significance:
The Piercing Line candlestick pattern is a robust indication of a possible shift in market sentiment from bearish to bullish. It suggests that the sellers’ control is waning, and buyers are beginning to assert themselves.
The bearish candle in this pattern represents the dominance of sellers. However, the gap-down opening of the bullish candle signifies a change in sentiment. This opening reflects the market’s willingness to open lower but then reverse to close higher.
The bullish candle that follows penetrates the real body of the prior bearish candle, signalling an eagerness among buyers to challenge and potentially reverse the bearish trend.
The significance of the Piercing Line candlestick pattern is strengthened when the bullish candle is not only able to overcome the bearish pressure but also close significantly above the midpoint of the bearish candle’s real body.
Confirmation and Trading Strategy:
To confirm the Piercing Line candlestick pattern, traders often look for additional bullish price action in subsequent candles after the pattern formation. It’s crucial to see follow-through buying.
Entering a trade based on the Piercing Line pattern typically involves placing a buy order above the high of the bullish candle. This approach allows traders to capitalize on the expected bullish movement.
Traders may also incorporate additional technical indicators and analysis to enhance the pattern’s reliability. Elements such as volume trends, support and resistance levels, and trendline analysis can provide further confirmation.
Bullish Harami:
The Bullish Harami is a distinctive two-candlestick pattern commonly used in technical analysis to identify potential bullish trend reversals. This pattern holds significance due to its ability to signal a shift in market sentiment from bearish to bullish.
To gain a deeper understanding of the Bullish Harami pattern, let’s explore its components, interpretation, and trading implications in more detail:
Components and Appearance:
Two Candles: The Bullish Harami candlestick pattern consists of two individual candles, each playing a crucial role in conveying market sentiment.
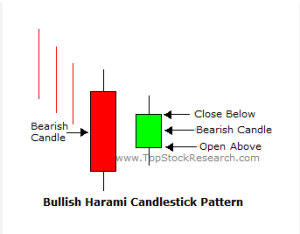
Bearish Candle: The pattern begins with a prominent bearish (red or black) candle. This candle typically reflects the existing bearish pressure in the market and tends to have a substantial real body. The bearish candle opens near its high and closes lower, suggesting a downward momentum.
Bullish Candle: Following the bearish candle, the Bullish Harami features a smaller bullish (green or white) candle. The defining characteristic of this candle is that its entire real body is contained within the real body of the preceding bearish candle. In essence, it opens within the range of the bearish candle and closes within it.
Interpretation and Significance:
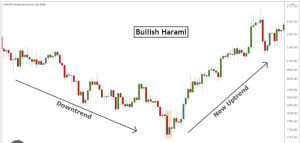
The Bullish Harami candlestick pattern is a reliable indicator of a potential shift in market sentiment from bearish to bullish. It suggests that the influence of sellers is diminishing, and buyers are beginning to assert themselves.
The bearish candle in the candlestick pattern represents the prevailing control of sellers, signifying a dominant bearish sentiment. However, the subsequent appearance of a smaller bullish candle contained entirely within the real body of the previous bearish candle signifies a notable change in sentiment.
The containment of the bullish candle within the bearish candle’s real body indicates that the range of price movement for the bullish session is wholly within the prior bearish range. This suggests a market in which buyers are gaining strength and preventing further downside movement.
The Bullish Harami candlestick pattern can be particularly potent when accompanied by an increase in trading volume and when observed after a prolonged downtrend, adding further confirmation to the potential bullish reversal.
Confirmation and Trading Strategy:
Confirmation of the Bullish Harami candlestick pattern often involves monitoring the price action in subsequent candles after the pattern formation. The appearance of additional bullish candles, especially those closing above the Bullish Harami’s high, supports the pattern’s significance.
To implement a trading strategy based on the Bullish Harami, traders frequently place buy orders above the high of the bullish candle. This approach allows traders to capitalize on the expected bullish movement.
As with many candlestick patterns, incorporating complementary technical indicators and analysis, such as volume trends, support and resistance levels, and trendline analysis, can enhance the pattern’s reliability and provide more robust trading signals.
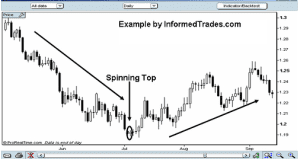
Bullish Spinning Top:
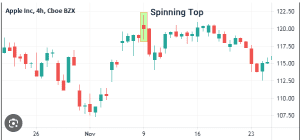
The Bullish Spinning Top is a single-candlestick pattern commonly encountered in technical analysis. It often acts as a signal of market indecision, providing traders with valuable insights into the potential for a bullish reversal.
To gain a deeper understanding of the Bullish Spinning Top pattern, let’s explore its characteristics, interpretation, and practical implications in more detail:
Characteristics and Appearance:
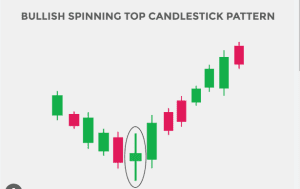
Single Candle: The Bullish Spinning Top consists of only one candle. It is distinguished by its relatively small real body compared to the surrounding candlesticks.
Small Real Body: The real body of the Bullish Spinning Top is typically small, signifying that the opening and closing prices are close to each other. This proximity of open and close prices suggests indecision in the market and a struggle between buyers and sellers.
Upper and Lower Shadows: What makes the Bullish Spinning Top distinctive are its upper and lower shadows, also known as wicks. These shadows extend above and below the small real body, indicating that prices moved significantly in both directions during the trading session.
Interpretation and Significance:
The Bullish Spinning Top candlestick pattern serves as a reflection of market uncertainty and indecision. It implies that neither buyers nor sellers have established full control during the session, resulting in a narrow trading range and a small real body.
While this pattern alone does not guarantee a bullish reversal, it does raise the possibility of such a reversal occurring. The proximity of open and close prices implies that neither side was able to maintain dominance, and this balance may shift in favour of the bulls.
The appearance of a Bullish Spinning Top after a sustained downtrend suggests that sellers may be losing momentum, opening the door for potential buyers to regain control. However, traders should be cautious and consider this pattern within the context of broader market analysis.
Confirmation and Trading Strategy:
Confirmation of the Bullish Spinning Top pattern can be sought by monitoring subsequent price action. Traders look for a follow-through with strong bullish candles in the next sessions, indicating that buyers are indeed gaining the upper hand.
A common trading strategy based on the Bullish Spinning Top is to place a buy order above the high of the Bullish Spinning Top candlestick. This approach aims to capture potential upward momentum as it develops.
As with all candlestick patterns, traders often enhance their analysis by incorporating additional technical indicators and chart patterns to increase the accuracy of their trading decisions.
Bullish Marubozu:
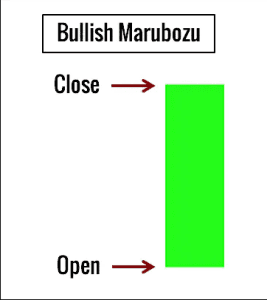
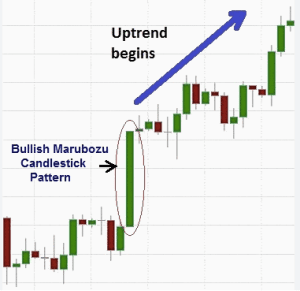
Bullish Marubozu is a distinct single-candlestick pattern commonly encountered in technical analysis. It is characterized by its complete lack of shadows (wicks) and a long real body. This pattern carries significant information about market sentiment and offers insights into the potential for a strong bullish trend.
To gain a deeper understanding of the Bullish Marubozu pattern, let’s explore its characteristics, interpretation, and practical implications in more detail:
Characteristics and Appearance:
Single Candle: Bullish Marubozu consists of just one candle, making it easy to identify on a price chart.
No Shadows: One of the most distinguishing features of this candlestick pattern is the complete absence of shadows, both upper and lower. The real body, which represents the price range between the open and close, spans from the low to the high of the trading session.
Long Real Body: The real body of Bullish Marubozu is notably long, indicating a substantial price movement during the session. It opens at the low of the period and closes at the high.
Interpretation and Significance:
The Bullish Marubozu candlestick pattern is a strong signal of bullish sentiment and suggests that buyers have maintained control throughout the trading session. The absence of shadows underscores the dominance of buyers who managed to push prices significantly higher from the opening level.
The fact that the candle opens at the low and closes at the high emphasizes the determination of buyers and their ability to drive prices up without allowing sellers to regain control.
This pattern often occurs after a period of market consolidation or a previous bearish trend. Its emergence indicates a strong shift in sentiment, making it a potential entry point for traders looking to capitalize on a developing bullish trend.
Confirmation and Trading Strategy:
Confirmation of the Bullish Marubozu candlestick pattern can be sought through subsequent price action. Traders often look for consecutive strong bullish candles that indicate the continuation of the bullish trend.
A common trading strategy based on Bullish Marubozu is to initiate a long (buy) position at the opening of the next trading session, anticipating that the bullish momentum will persist.
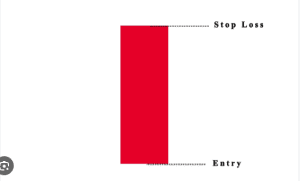
Risk management is vital in trading, and protective stop-loss orders are often placed below the low of the Bullish Marubozu candle to limit potential losses in case the trend does not materialize as expected.
Three Inside Up:
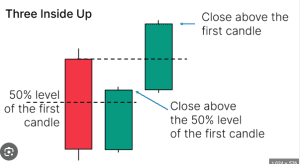
Three Inside Up is a notable bullish reversal candlestick pattern in the realm of technical analysis. This pattern comprises a sequence of three candles and is recognized for signalling a potential shift in market sentiment from bearish to bullish.
To grasp the nuances of the Three Inside Up pattern, let’s delve into its distinct characteristics, how it is interpreted, and its practical implications:
Characteristics and Appearance:
Three-Candle Formation: Three Inside Up consists of precisely three candles, which appear sequentially on a price chart.
Bullish Reversal: This pattern is categorized as a bullish reversal pattern, suggesting that it often emerges at the conclusion of a downtrend, signalling a possible trend reversal to the upside.
Candle Hierarchy: The first candle in the sequence is a bearish (downward) candlestick. It is followed by the second and third candles, which are both bullish (upward) candlesticks.
Enclosed Structure: A hallmark of the Three Inside Up pattern is that the second and third candles are entirely contained within the body of the first candle. This containment signifies that the prior bearish trend is losing momentum, and buyers are taking control.
Interpretation and Significance:
Three Inside Up is a reliable indication of a potential bullish reversal, and it underscores a transition in market sentiment. The fact that the second and third candles are wholly confined within the prior bearish candle demonstrates a clear shift from bearish to bullish pressure.
The pattern shows that after the bearish sentiment established in the first candle, buyers are not only active but also capable of completely erasing the prior losses, pushing the price higher.
This pattern is often viewed as a point of entry for traders who are inclined to take long (buy) positions. It can be particularly attractive after a downtrend, as it signifies the potential initiation of a new bullish phase.
Confirmation and Trading Strategy:
To validate the Three Inside Up candlestick pattern, traders typically seek additional bullish confirmation through subsequent price action. A series of strong bullish candles following the pattern can fortify the signal.
Traders commonly consider entering a long position at the opening of the next trading session after the formation of the Three Inside Up pattern. This entry is founded on the anticipation that the bullish momentum is likely to persist.
Risk management is a vital aspect of trading. Protective stop-loss orders are often positioned below the low of the Three Inside Up pattern to mitigate potential losses if the expected bullish trend does not materialize.
Read Also: 7 Candlestick Patterns Every Trader Should Know
⇓ Candlestick Patterns PDF Download Here ⇓
Bearish Candlestick Patterns:
Bearish candlestick patterns are formations on a price chart that suggest a potential downward movement in the price of an asset. These patterns are typically considered negative signals by traders, indicating a higher probability of a downward trend or bearish reversal. Bearish candlestick patterns often occur after an uptrend or during a consolidation phase, signalling a shift in market sentiment favouring sellers.
Now let’s take a look at some of the most common bearish candlestick patterns:
- Shooting Star
- Bearish Engulfing Pattern
- Evening Star
- Dark Cloud Cover
- Bearish Harami
- Bearish Spinning Top
- Bearish Marubozu
- Three Inside Down
Shooting Star:
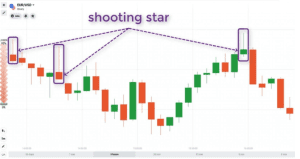
The Shooting Star is a noteworthy candlestick pattern frequently utilized in technical analysis to identify potential trend reversals. This pattern is characterized by its distinctive appearance and significance, which we will explore in detail:
Characteristics and Appearance:
Single Candle Formation: The Shooting Star is a single candlestick pattern, meaning it consists of just one candle on a price chart.
Uptrend Reversal: This pattern generally materializes following an uptrend, indicating its potential to mark a shift from a bullish to a bearish sentiment in the market.
Candle Structure: The Shooting Star’s structure is defined by two key elements:
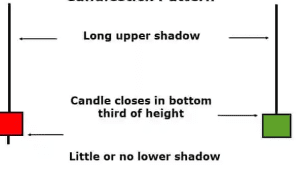
Small Real Body: The real body, which represents the price range between the opening and closing prices, is relatively small. It may be bullish or bearish but is typically small in comparison to recent candles.
Long Upper Shadow: The most prominent feature of the Shooting Star is its extended upper shadow (also known as the upper wick). This upper shadow protrudes above the real body, often to a considerable length. This extended shadow signifies the critical price level where the market encountered significant selling pressure during the session.
Interpretation and Significance:
The Shooting Star is regarded as a bearish reversal pattern, which implies that its appearance following an uptrend suggests a potential transition from bullish to bearish market sentiment.
The small real body signifies that the session witnessed only modest price movement between the opening and closing prices, reflecting a degree of market indecision.
The most pivotal aspect of the Shooting Star is the long upper shadow. This upper shadow demonstrates that even though the session may have commenced with bullish momentum, it was met with substantial selling pressure, pushing the price downward. The upper shadow’s length serves as a strong indication of the extent of this selling pressure.
The long upper shadow essentially points to the rejection of higher prices by the market, emphasizing that sellers overpowered buyers during the session.
Confirmation and Trading Strategy:
While the Shooting Star pattern alone is a valuable indicator of a potential bearish reversal, traders often seek additional confirmation before making trading decisions. This confirmation can come from observing the following:
Subsequent Price Action: Traders look for a sequence of bearish candles in the sessions that follow the Shooting Star, indicating the continuation of the bearish momentum.
Other Technical Indicators: Traders often complement the Shooting Star signal with other technical analysis tools or indicators to strengthen their conviction.
Trading Strategy: Traders may opt for a short (sell) position or consider exiting long (buy) positions when a Shooting Star forms. Entry and exit points are typically determined with caution to manage risk and potential losses.
Risk Management: Protective stop-loss orders are often placed above the high of the Shooting Star pattern to limit losses if the market does not proceed in the anticipated bearish direction.
Bearish Engulfing:
The Bearish Engulfing candlestick pattern is a widely recognized signal in technical analysis that points to a potential reversal in an ongoing uptrend. Its distinct structure and significance make it a valuable tool for traders and investors. Let’s delve deeper into the details of this pattern:
Characteristics and Appearance:
Two-Candle Formation: The Bearish Engulfing pattern consists of two individual candles on a price chart.
Uptrend Reversal: This pattern typically emerges after a preceding uptrend, implying its potential to mark a shift from a bullish to a bearish market sentiment.
Candle Structure: The Bearish Engulfing’s structure involves the following essential components:
First Candle (Bullish): The pattern commences with a small bullish (green or white) candle, often representing the closing price higher than the opening price. This candle signifies the existing bullish momentum.
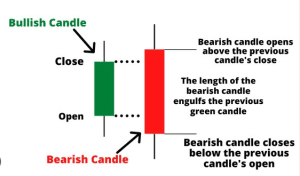
Second Candle (Bearish): The second candle in the pattern is a larger bearish (red or black) candle, which entirely engulfs the real body of the preceding bullish candle. The bearish candle usually opens below the prior bullish candle’s opening price and closes below its closing price.
Interpretation and Significance:
The Bearish Engulfing pattern is a potent bearish reversal signal, indicating a possible shift in market sentiment from bullish to bearish.
The engulfing nature of the second bearish candle, completely covering the first bullish candle, underscores the dominance of selling pressure over buying pressure during the formation of the pattern.
It reflects a decisive change in market sentiment, where the initial optimism of buyers is overwhelmed by a sudden surge of selling activity.
Confirmation and Trading Strategy:
While the Bearish Engulfing pattern alone is a robust indication of a bearish reversal, traders frequently seek additional confirmation to reinforce their trading decisions. This may entail looking for the following:
Subsequent Price Action: Traders often anticipate further bearish candles following the Bearish Engulfing pattern, validating the continuation of the bearish trend.
Supplementary Indicators: Traders may incorporate other technical indicators or chart patterns to enhance their analysis and decision-making.
Trading Strategy: Traders typically consider opening a short (sell) position or exiting long (buy) positions upon the formation of a Bearish Engulfing pattern. Entry and exit points are calculated judiciously to manage risk.
Risk Management: To mitigate potential losses, protective stop-loss orders are frequently positioned above the high of the Bearish Engulfing pattern.
There are still about 14 candlestick patterns left to write about and if you find this already overwhelming, I have made it easier by allowing you to download the pdf format of this article, where you can take your time to read and understand most of the candlestick patterns we have.
You can download the complete candlestick patterns pdf guide by clicking the download button below the PDF viewer. You can also read the complete 24 powerful candlestick patterns ebook using the PDF viewer below if you won’t like to download it.
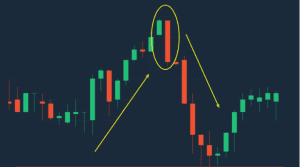
Evening Star:
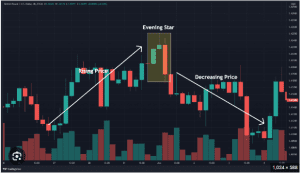
The Evening Star candlestick pattern is a powerful and widely recognized candlestick pattern in the realm of technical analysis. Comprising three candles, this pattern holds significant implications for traders and investors. Let’s explore the intricate details of the Evening Star pattern:
Characteristics and Structure:
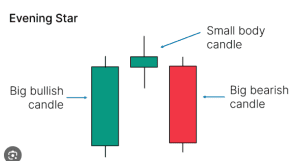
Three-Candle Formation: The Evening Star candlestick pattern is characterized by three individual candles, each playing a distinctive role in signalling a potential bearish reversal.
Uptrend Reversal: This pattern usually unfolds after an established uptrend, implying a transition from bullish to bearish market sentiment.
Candle Arrangement: The Evening Star exhibits the following key components:
First Candle (Bullish): The pattern initiates with a large bullish (green or white) candle, representing the continuation of the existing uptrend. This candle often signifies strong buying pressure.
Second Candle (Small and Indecisive): The second candle is typically a small-bodied candle with a limited price range, reflecting market indecision and a potential stall in the bullish momentum.
Third Candle (Bearish): The pattern concludes with a large bearish (red or black) candle, characterized by a substantial downward price movement. This candle is a compelling sign of the bearish reversal.
Interpretation and Significance:
The Evening Star candlestick pattern is a robust bearish reversal pattern, suggesting a shift in market sentiment from bullish to bearish.
The first bullish candle represents the prevailing optimism of buyers, followed by the small indecisive candle, which indicates uncertainty and a potential loss of bullish momentum.
The third bearish candle is particularly significant, as it clearly reflects a bearish takeover, with sellers seizing control and driving prices downward.
Confirmation and Trading Strategy:
Traders often combine the Evening Star candlestick pattern with additional confirming factors to strengthen their trading decisions, such as:
Subsequent Price Movement: Confirmatory bearish candles in the sessions following the Evening Star pattern can provide further evidence of a bearish trend reversal.
Technical Indicators: Utilizing complementary technical indicators or other chart patterns can enhance the analysis and decision-making process.
Trading Strategy: Traders frequently initiate short (sell) positions or exit long (buy) positions upon identifying the Evening Star pattern. Entry and exit points are meticulously chosen to manage risk and optimize potential returns.
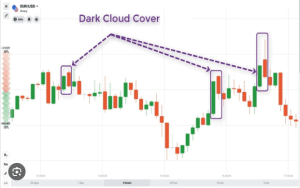
Dark Cloud Cover:
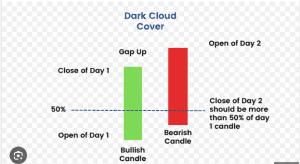
The Dark Cloud Cover candlestick pattern is a prominent and insightful candlestick pattern that traders often utilize in technical analysis to detect potential bearish reversals. This pattern consists of two candles and typically appears following an uptrend. Let’s delve into the comprehensive details of the Dark Cloud Cover pattern:
Characteristics and Structure:
Two-Candle Formation: The Dark Cloud Cover candlestick pattern involves two distinct candles, each with a specific role in indicating a potential bearish reversal.
Uptrend Reversal: This pattern usually emerges after a prevailing uptrend in the market, signalling a shift from bullish to bearish sentiment.
Candle Arrangement: The Dark Cloud Cover showcases the following key components:
First Candle (Bullish): The pattern commences with a bullish (green or white) candle, symbolizing the continuation of the existing uptrend. This candle characteristically represents robust buying pressure.
Second Candle (Bearish): The second candle is a bearish (red or black) candle that entirely engulfs the prior bullish candle’s body. It indicates a potential shift in market sentiment from bullish to bearish.
Interpretation and Significance:
The Dark Cloud Cover is a compelling bearish reversal pattern, suggesting that the bullish momentum may be waning.
The first bullish candle implies an extension of the uptrend, reflecting optimism among buyers.
The second bearish candle, however, is pivotal. Its body completely engulfs the previous bullish candle’s body, revealing a shift in control from buyers to sellers. This is a strong signal of potential bearishness.
Confirmation and Trading Strategy:
Traders often look for additional confirmation factors to strengthen the reliability of the Dark Cloud Cover pattern, including:
Follow-up Price Action: Monitoring subsequent bearish candles or a general bearish trend after the pattern can provide further confirmation of the potential reversal.
Technical Indicators: Integrating technical indicators, such as moving averages or relative strength indicators, can complement the analysis.
Trading Strategy: Upon recognizing the Dark Cloud Cover pattern, traders may consider initiating short (sell) positions or exiting long (buy) positions. Entry and exit points are carefully chosen to manage risk and enhance potential returns.
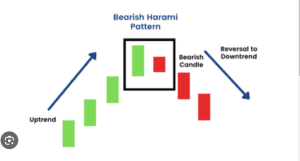
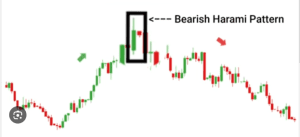
Bearish Harami:
Bearish Harami is a candlestick pattern that typically marks a potential trend reversal in a financial market. This pattern consists of two candles and is characterized by the following elements:
First Candle: The candlestick pattern begins with a large bullish (green or white) candle. This candle indicates a strong uptrend or bullish sentiment in the market. The size and strength of this candle are essential in determining the significance of the pattern.
Second Candle: Following the large bullish candle, a smaller bearish (red or black) candle appears. What sets the Bearish Harami apart from other patterns is that the second candle is entirely contained within the body of the first candle. In other words, the high and low of the bearish candle are within the range of the previous bullish candle.
The Bearish Harami candlestick pattern is a signal to traders and investors that the bullish momentum may be weakening and that a potential bearish reversal could be on the horizon. While it does not guarantee a trend reversal, it serves as an early warning sign for those who closely follow candlestick patterns and technical analysis.
Bearish Spinning Top:
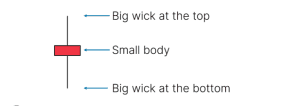
The Bearish Spinning Top candlestick pattern is an essential candlestick pattern that holds a significant place in the realm of technical analysis. This pattern is similar to its bullish counterpart, the Bullish Spinning Top, but carries the opposite implication – a potential bearish reversal. Let’s delve into a detailed explanation of the Bearish Spinning Top:
Characteristics and Structure:
Single Candle Formation: The Bearish Spinning Top is a single-candle pattern, making it relatively simple yet insightful.
Market Indecision: It represents a state of indecision in the market where neither bulls nor bears have a firm grip on control.
Visual Appearance: The visual aspect of a Bearish Spinning Top is defined by a small real body, signifying minimal price difference between the opening and closing prices.
Upper and Lower Shadows: What makes this pattern distinctive are its relatively long upper and lower shadows, demonstrating that price fluctuations occurred both above and below the real body.
Interpretation and Significance:
The Bearish Spinning Top serves as an alert to traders that the balance of power in the market is shifting from bullish to bearish sentiment.
The small real body is an indicator of uncertainty and conflict between buyers and sellers.
The long upper and lower shadows underscore the struggle for control, with price fluctuations in both directions.
It’s important to note that while the Bearish Spinning Top suggests a potential bearish reversal, it doesn’t provide a strong enough signal on its own. Traders often look for additional confirmation factors to validate its significance.
Confirmation and Trading Strategy:
Traders often use the Bearish Spinning Top candlestick pattern in conjunction with other technical indicators or chart patterns to enhance its reliability.
Supplementary confirmation may come from observing subsequent bearish candles or a general bearish trend following the appearance of the pattern.
Trading decisions based on the Bearish Spinning Top might include initiating short (sell) positions or exiting long (buy) positions. Entry and exit points should be chosen carefully to manage risk and improve potential returns.
Bearish Marubozu:
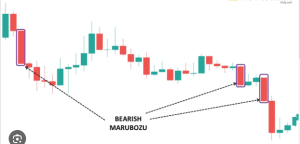
The Bearish Marubozu candlestick pattern is a vital component of the vast array of candlestick patterns used in technical analysis. It stands in direct contrast to its bullish counterpart, the Bullish Marubozu, as it signifies a strong bearish sentiment in the market. Let’s explore the Bearish Marubozu pattern in detail:
Characteristics and Structure:
Single Candle Formation: Similar to many other candlestick patterns, the Bearish Marubozu consists of a single candle. Its simplicity makes it a straightforward yet potent indicator.
Long Real Body: The defining feature of a Bearish Marubozu is a long real body. The real body encompasses the price difference between the opening and closing prices. In the case of the Bearish Marubozu, the real body is lengthy and opens at the high of the trading session and closes at the low.
Absence of Shadows: What sets the Bearish Marubozu apart is the absence of both upper and lower shadows, implying that there were no significant price fluctuations during the trading period.
Interpretation and Significance:
The Bearish Marubozu candlestick pattern is a strong indicator of bearish sentiment in the market. The long black (or red) real body, opening at the high and closing at the low, underscores the dominance of sellers throughout the session.
The absence of shadows signifies a complete lack of bullish attempt to regain control during the trading period.
This pattern often emerges after a period of significant upward movement, highlighting a sudden shift towards bearish pressure.
Confirmation and Trading Strategy:
Traders frequently use the Bearish Marubozu as a standalone signal due to its robust and clear-cut nature. When this pattern appears after a bullish trend, it’s often regarded as a compelling indication of an imminent bearish reversal.
Trading strategies based on the Bearish Marubozu may involve initiating short (sell) positions or closing out long (buy) positions. The entry and exit points should be chosen prudently to manage risk effectively.
Stop-loss orders and other risk management techniques are essential when trading with the Bearish Marubozu. This pattern is influential, but no trading signal is foolproof.
Three Inside Down:
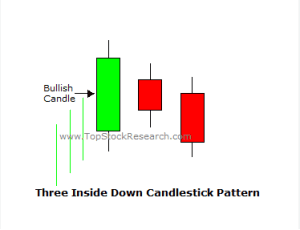
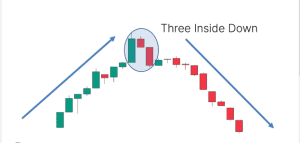
The Three Inside Down candlestick pattern is a significant reversal pattern in the realm of candlestick analysis. It stands in direct contrast to the Three Inside Up pattern and is known for its bearish implications. In this detailed explanation, we’ll explore the structure, interpretation, and trading significance of the Three Inside Down pattern.
Characteristics and Structure:
Three-Candle Formation: The Three Inside Down candlestick pattern is formed by three consecutive candlesticks. Its multi-candle structure provides a deeper insight into the shifting market sentiment.
Bearish Reversal: This pattern is categorized as a bearish reversal pattern, meaning it is often observed at the end of an uptrend.
Previous Uptrend: The Three Inside Down formation appears after a preceding uptrend, which is important for understanding its reversal potential.
Inward Pattern: The defining characteristic of the Three Inside Down pattern is that both the second and third candles are entirely contained within the real body of the preceding bullish candle.
Interpretation and Significance:
The Three Inside Down candlestick pattern signals a transition from bullish to bearish sentiment. The prior uptrend loses its momentum as bearish pressure starts to build.
The first candle in the formation is typically a large bullish candle, signalling the continuation of the existing trend.
However, the second candle, often referred to as the “inside” candle, is a bearish one and, crucially, it is completely encompassed by the real body of the first bullish candle.
The third candle reinforces the bearish signal by opening lower and closing even lower, completing the pattern. The second and third candles within the pattern validate the bearish reversal by demonstrating that bears have successfully wrestled control from the bulls.
Confirmation and Trading Strategy:
The Three Inside Down candlestick pattern is widely regarded as a reliable bearish reversal signal. Traders often use it to enter short (sell) positions or exit long (buy) positions.
When trading based on this pattern, it’s essential to consider risk management strategies. Stop-loss orders, for instance, can help mitigate potential losses if the market does not follow the expected reversal.
The reversal’s strength may be enhanced if other technical indicators or patterns also signal a bearish shift.
Read Also: 8 Chart Patterns Every Beginner Trader Must Know to Succeed in Trading
Reversal Candlestick Patterns
Reversal candlestick patterns are formations on a price chart that indicate a potential change in the prevailing trend. These patterns suggest a shift in market sentiment, signalling that the current trend may be coming to an end, and a reversal or change in direction could occur. Traders often use reversal candlestick patterns to identify potential entry or exit points in the market.
Now I will highlight some of the most common reversal candlestick patterns you will always find in your trading chart.
Doji:
The Doji is a critical single-candlestick pattern in the realm of technical analysis. Known for its unique structure and the insights it offers into market sentiment, the Doji holds a special place in the toolkit of traders. In this detailed explanation, we will delve into the characteristics, interpretations, and trading significance of the Doji pattern.
- Doji
- Long-legged Doji
- Dragonfly Doji
- Gravestone Doji
- Hanging Man
- Inverted Hammer
- Tweezer Tops
- Tweezer Bottoms
Characteristics and Structure:
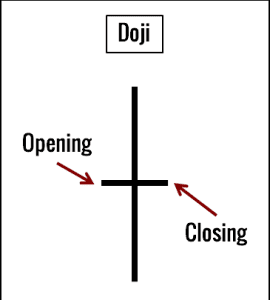
Single Candlestick: The Doji pattern consists of a single candlestick, making it a straightforward yet insightful formation.
Small Real Body: A Doji features a small real body, which represents the difference between the opening and closing prices during a specific time period.
Equal Shadows: What sets the Doji apart is that it has almost equal-length upper and lower shadows (wicks or tails), indicating that neither bulls nor bears had full control over the trading session.
Interpretation and Significance:
The Doji is a symbol of market indecision. It implies that during the given period, neither buyers nor sellers managed to dominate the price action.
This indecision often occurs when the market is in a state of equilibrium, and forces are evenly matched.
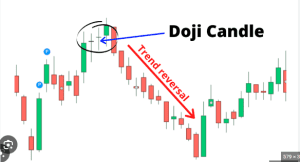
The Doji suggests that a potential trend reversal could be on the horizon. However, it does not specify the direction of the reversal.
To gauge the implications of a Doji, traders often consider the context in which it appears. For instance, if a Doji occurs after a strong uptrend, it may signal the potential for a bearish reversal, and conversely, if it appears after a downtrend, a bullish reversal might be indicated.
Confirmation and Trading Strategy:
Doji patterns are not trading signals by themselves. Traders often use them in conjunction with other technical indicators or chart patterns to make well-informed decisions.
The confirmation of a reversal typically comes from observing subsequent price action. If, following a Doji, prices move decisively in one direction, it can be viewed as a confirmation of the potential trend reversal.
Stop-loss and take-profit orders are often employed when trading based on Doji patterns to manage risk effectively.
Long-Legged Doji:
The Long-Legged Doji is a significant variation of the classic Doji candlestick pattern. Recognizable by its long upper and lower shadows, this pattern conveys even greater market indecision and uncertainty about future price direction. In this detailed exploration, we will uncover the specific characteristics, interpretations, and implications of the Long-Legged Doji pattern.
Characteristics and Structure:
Single Candlestick: Similar to the traditional Doji, the Long-Legged Doji consists of a single candlestick.
Small Real Body: It features a small real body that represents the minimal difference between the opening and closing prices during the specified time period.
Long Upper and Lower Shadows: What sets the Long-Legged Doji apart are its notably long upper and lower shadows (wicks or tails). These shadows are significantly longer than those of a standard Doji, indicating a high level of market indecision.
Interpretation and Significance:
The Long-Legged Doji is a clear sign of extreme market indecision and uncertainty. It reflects a strong balance between buyers and sellers throughout the trading period.
This pattern suggests that market participants are highly uncertain about the future direction of prices. It’s as if they’ve reached a stalemate, unable to push the price decisively in either direction.
While the Long-Legged Doji signifies potential trend reversals, it doesn’t provide guidance on the direction of the reversal. Traders must consider the broader context to determine whether it might lead to a bullish or bearish reversal.
Contextual Analysis:
To effectively use the Long-Legged Doji for trading decisions, traders need to analyze the overall market context. For instance, if this pattern occurs after a strong uptrend, it may indicate the potential for a bearish reversal. Conversely, if it appears following a downtrend, it might suggest a bullish reversal.
Confirmation and Trading Strategy:
As with standard Doji patterns, the Long-Legged Doji is often used in conjunction with other technical indicators or chart patterns for confirmation and a more comprehensive trading strategy.
Traders await subsequent price action for confirmation of a reversal. A decisive move in one direction following the Long-Legged Doji may be considered a confirmation of the potential trend reversal.
Effective risk management, including the use of stop-loss and take-profit orders, is a common practice when trading based on Long-Legged Doji patterns.
Dragonfly Doji:
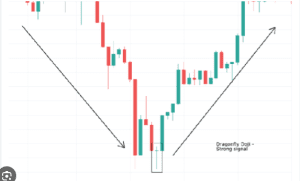
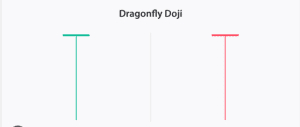
The Dragonfly Doji is a notable single candlestick pattern frequently encountered in technical analysis. This pattern is characterized by a small real body, which is typically in the shape of a horizontal line with little to no vertical length.
What sets the Dragonfly Doji apart is the absence of an upper shadow and the presence of a lower shadow. This unique structure can provide traders and analysts with valuable insights into potential market reversals.
Here is a comprehensive explanation of the Dragonfly Doji pattern, its significance, and how to interpret it when encountered on a price chart.
Key Features of the Dragonfly Doji:
Small Real Body: The Dragonfly Doji has a small real body, indicating that the opening and closing prices are very close or nearly identical. This formation implies a state of market equilibrium and indecision.
No Upper Shadow: Unlike many other candlestick patterns, the Dragonfly Doji lacks an upper shadow. The absence of an upper shadow suggests that buyers controlled the entire trading session, pushing prices up from the opening level and preventing any significant retracement during the session.
Lower Shadow: The Dragonfly Doji has a notable lower shadow, extending below the real body. This lower shadow represents the lowest price traded during the session.
Interpreting the Dragonfly Doji:
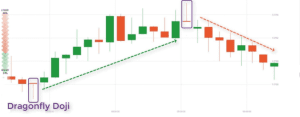
The Dragonfly Doji holds significance due to its portrayal of a potential trend reversal, particularly when it appears after a sustained downtrend. Here’s how to interpret this candlestick pattern:
Bullish Reversal Signal: When the Dragonfly Doji materializes after a downtrend, it signals a potential reversal from bearish to bullish sentiment. The absence of an upper shadow indicates that sellers were unable to push prices lower during the session, and the presence of a lower shadow suggests that buyers attempted to drive prices upward.
Indecision and Market Turning Point: The Dragonfly Doji reflects market indecision and a struggle between buyers and sellers. It indicates that the balance may be shifting in favour of buyers. Traders should watch for confirmation from subsequent price action.
Confirmation Required: To make informed trading decisions, it’s essential to seek confirmation of the bullish reversal. Traders should look for follow-up candlesticks that continue the upward price movement. This confirmation can strengthen the signal provided by the Dragonfly Doji.
Dragonfly Doji Trading Strategies:
While the Dragonfly Doji alone suggests a potential reversal, traders often combine it with other technical indicators or patterns to enhance its reliability. Some trading strategies involving the Dragonfly Doji include:
Waiting for Confirmation: Traders may wait for one or more bullish candlesticks after the Dragonfly Doji to confirm the bullish reversal. This approach helps reduce false signals.
Using Support Levels: Identifying key support levels in the vicinity of the Dragonfly Doji can provide additional confidence in the potential reversal.
Incorporating Oscillators: Traders may use oscillators like the Relative Strength Index (RSI) or the Moving Average Convergence Divergence (MACD) to complement their analysis and confirm bullish momentum.
Gravestone Doji:
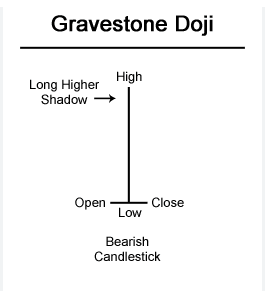
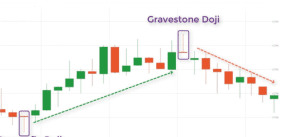
The Gravestone Doji candlestick pattern is a distinct single candlestick pattern found in technical analysis, known for its potential to signal a bearish reversal in the financial markets. It is characterized by a small real body, the absence of a lower shadow, and the presence of an upper shadow.
This candlestick pattern often emerges during periods of market indecision and can provide traders and analysts with valuable insights into potential changes in market sentiment.
Here is an in-depth examination of the Gravestone Doji candlestick pattern, including its unique features, significance, and how to interpret it when encountered on a price chart.
Key Characteristics of the Gravestone Doji:
Small Real Body: The Gravestone Doji candlestick pattern is characterized by a small real body, where the opening and closing prices are nearly identical or very close to each other. This reflects market equilibrium and indecision.
No Lower Shadow: In contrast to many other candlestick patterns, the Gravestone Doji does not possess a lower shadow. It indicates that sellers dominated the entire trading session, keeping prices at or near their lowest levels.
Upper Shadow: The Gravestone Doji features a noticeable upper shadow, extending above the real body. This upper shadow represents the highest price traded during the session.
Interpreting the Gravestone Doji:
The Gravestone Doji is considered significant due to its potential to indicate a bearish reversal, particularly when it appears after a prolonged uptrend. Here’s how to interpret this candlestick pattern:
Bearish Reversal Signal: When the Gravestone Doji manifests after an uptrend, it serves as a potential reversal signal from a bullish to a bearish trend. The absence of a lower shadow suggests that buyers were unable to push prices higher during the session, and the presence of an upper shadow indicates that sellers attempted to drive prices downward.
Market Indecision and Turning Point: The Gravestone Doji conveys market indecision and a tug of war-between buyers and sellers. It suggests that the balance may be shifting in favour of the sellers. However, traders should await confirmation from subsequent price action before making definitive trading decisions.
Confirmation is Crucial: To enhance the reliability of the bearish reversal signal, traders should look for confirmation from subsequent candlesticks that continue the downward price movement. This confirmation can bolster the signal provided by the Gravestone Doji.
Gravestone Doji Trading Strategies:
While the Gravestone Doji alone suggests a potential bearish reversal, traders often employ additional technical indicators or patterns to strengthen its reliability. Some trading strategies involving the Gravestone Doji include:
Confirmation Through Subsequent Candlesticks: Traders may seek confirmation through one or more bearish candlesticks following the Gravestone Doji to validate the bearish reversal.
Identifying Resistance Levels: Traders can pinpoint key resistance levels near the Gravestone Doji on the price chart. These levels can provide additional confidence in the potential reversal.
Utilizing Oscillators: Traders may incorporate oscillators like the Relative Strength Index (RSI) or the Moving Average Convergence Divergence (MACD) to complement their analysis and confirm the bearish momentum.
⇓ Candlestick Patterns PDF Download Here ⇓
Hanging Man:
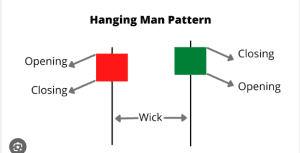
The Hanging Man is a vital single candlestick pattern in the realm of technical analysis, renowned for its potential to foreshadow a bearish trend reversal in financial markets. It is defined by a specific set of characteristics, including a small real body, a lengthy lower shadow, and a relatively short upper shadow.
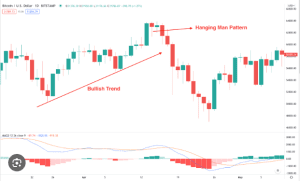
This pattern typically emerges following an uptrend and carries valuable implications for traders and analysts seeking to interpret market dynamics.
To fully grasp the Hanging Man candlestick pattern, it is crucial to delve into its unique features, understand its significance, and explore how to effectively interpret it when it makes an appearance on a price chart.
Key Characteristics of the Hanging Man:
Small Real Body: The Hanging Man candlestick pattern is identified by its petite real body. The opening and closing prices are either identical or exceedingly close to each other, revealing a balance between buyers and sellers during the trading session.
Long Lower Shadow: The standout attribute of the Hanging Man is its extended lower shadow, which projects beneath the real body. This shadow signifies a notable intraday price decline.
Short Upper Shadow: In contrast to the elongated lower shadow, the Hanging Man exhibits a short upper shadow. This short shadow indicates a limited intraday price increase above the opening level.
Interpreting the Hanging Man:
The Hanging Man candlestick pattern carries significance due to its potential to serve as a bearish reversal signal, especially when it unfolds at the conclusion of an uptrend. Here’s how to interpret the Hanging Man:
Bearish Reversal Signal: When the Hanging Man materializes following an uptrend, it functions as a potential warning of a reversal from a bullish to a bearish trend. The small real body reflects market indecision, while the extended lower shadow signifies that sellers momentarily pushed prices considerably lower during the session.
Market Uncertainty and Transition: The Hanging Man conveys uncertainty and hesitation among market participants. It suggests that after a prevailing uptrend, the bears are exerting influence, potentially heralding a transition to a bearish phase. However, traders should exercise caution and await further price action confirmation.
Confirmation is Key: For traders aiming to enhance the reliability of the bearish reversal signal, it is advisable to look for corroborative evidence in the form of subsequent bearish candlesticks that confirm the shift in sentiment. This added confirmation can strengthen the validity of the Hanging Man’s warning.
Hanging Man Trading Strategies:
While the Hanging Man, in isolation, indicates a possible bearish reversal, traders often complement its analysis with supplementary technical indicators or patterns to bolster its reliability. Some common strategies related to the Hanging Man pattern include:
Confirmation Via Subsequent Candlesticks: Traders frequently seek confirmation through one or more bearish candlesticks that materialize following the Hanging Man, validating the emerging bearish trend.
Identifying Support Levels: Identifying key support levels in close proximity to the Hanging Man on the price chart can offer additional confidence in the impending bearish reversal.
Incorporating Oscillators: The integration of technical oscillators such as the Relative Strength Index (RSI) or the Moving Average Convergence Divergence (MACD) can serve as valuable tools to complement Hanging Man analysis and affirm the emergence of a bearish momentum.
Inverted Hammer:
The Inverted Hammer candlestick pattern is an essential single candlestick pattern in the realm of technical analysis, renowned for its potential to foreshadow a bullish trend reversal in financial markets. It bears a resemblance to the Hanging Man but carries its unique significance when it emerges after a downtrend.
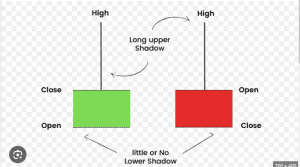
This pattern exhibits specific characteristics, including a small real body, a prolonged upper shadow, and a minimal or absent lower shadow, making it a crucial tool for traders and analysts seeking insights into market dynamics.
To gain a comprehensive understanding of the Inverted Hammer candlestick pattern, it’s imperative to delve into its defining features, grasp its importance, and explore how to effectively interpret it when it surfaces on a price chart.
Key Characteristics of the Inverted Hammer:
Small Real Body: The Inverted Hammer candlestick pattern is identified by a small real body, where the opening and closing prices are nearly identical or very close to each other. This signifies a balanced struggle between buyers and sellers during the trading session.
Long Upper Shadow: The standout attribute of the Inverted Hammer is its extended upper shadow, projecting above the real body. This upper shadow denotes a substantial intraday price increase above the opening level.
Minimal or Absent Lower Shadow: In many cases, the Inverted Hammer lacks a lower shadow or possesses an exceptionally short one, indicating minimal intraday price declines below the opening level.
Interpreting the Inverted Hammer:
The Inverted Hammer candlestick pattern holds significance due to its potential to serve as a bullish reversal signal, especially when it materializes following a downtrend. Here’s how to interpret the Inverted Hammer:
Bullish Reversal Signal: When the Inverted Hammer emerges after a downtrend, it functions as a potential indication of a shift from a bearish to a bullish trend. The small real body reflects market indecision, while the extended upper shadow reveals that buyers were able to momentarily push prices significantly higher during the session.
Market Transition and Emerging Bullish Sentiment: The Inverted Hammer communicates uncertainty and a shift in market sentiment. After a prevailing downtrend, the bulls start to exert influence, potentially heralding a transition to a bullish phase. Nevertheless, it’s crucial for traders to await further price action to confirm the reversal.
Confirmation for Enhanced Reliability: Traders often look for complementary technical indicators or subsequent bullish candlesticks to strengthen the reliability of the Inverted Hammer’s bullish reversal signal. Confirmation through additional price action provides greater conviction.
Inverted Hammer Trading Strategies:
To maximize the efficacy of the Inverted Hammer pattern, traders employ a variety of strategies:
Confirmation with Subsequent Candlesticks: To enhance the reliability of the bullish reversal signal, traders seek validation through one or more bullish candlesticks that follow the Inverted Hammer. Such confirmation reinforces the emerging bullish trend.
Identifying Resistance Levels: Identifying key resistance levels in proximity to the Inverted Hammer on the price chart can provide added confidence in the impending bullish reversal.
Incorporating Oscillators: Technical oscillators like the Relative Strength Index (RSI) or the Moving Average Convergence Divergence (MACD) can complement Inverted Hammer analysis and help substantiate the emergence of a bullish momentum.
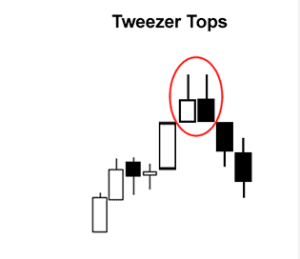
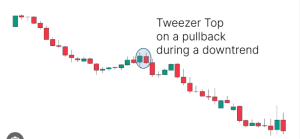
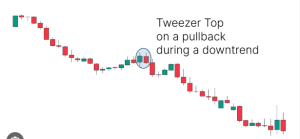
Tweezer Tops:
The Tweezer Tops is a prominent two-candlestick pattern in the realm of technical analysis, highly regarded for its potential to signal a forthcoming bearish reversal in financial markets. This pattern is characterized by two candlesticks forming twin peaks at the same price level, emphasizing potential resistance and a shift from a bullish to a bearish trend.
To fully grasp the significance of the Tweezer Tops candlestick pattern, it is essential to explore its defining attributes, comprehend its implications, and learn how to effectively interpret it when it materializes on a price chart.
Key Characteristics of the Tweezer Tops:
Two Identical Peaks: The Tweezer Tops candlestick pattern features two candlesticks with identical or nearly identical highs, forming twin peaks at the same price level. The first candlestick is typically bullish, followed by a second bearish one. These twin peaks underscore a key resistance level that the price failed to surpass.
Divergent Real Bodies: While the highs of the candlesticks are at the same level, the real bodies of the two candles exhibit opposite characteristics. The first candle is bullish, signifying upward momentum, while the second candle is bearish, indicating a reversal.
Interpreting the Tweezer Tops:
The Tweezer Tops candlestick pattern holds significance due to its potential to serve as a bearish reversal signal, primarily when it appears following an uptrend. Here’s how to interpret the Tweezer Tops pattern:
Bearish Reversal Indication: When Tweezer Tops manifest after a prevailing uptrend, they convey a potential shift from a bullish to a bearish trend. The pattern suggests that a strong resistance level has been established at the twin peaks, and it has halted further upward movement.
Market Transition and Emerging Bearish Sentiment: The Tweezer Tops pattern signifies a transition from a bullish market to a more bearish one. The rejection of higher prices at the twin peaks reflects an equilibrium between buyers and sellers, ultimately leading to a bearish sentiment.
Confirmation for Enhanced Reliability: Traders often seek confirmation through subsequent price action to strengthen the Tweezer Tops’ bearish reversal signal. Further bearish candlesticks or technical indicators can enhance the pattern’s reliability.
Tweezer Tops Trading Strategies:
To make the most of the Tweezer Tops candlestick pattern, traders apply various strategies:
Confirmation with Subsequent Candlesticks: Traders look for validation through one or more bearish candlesticks following the Tweezer Tops. Such confirmation reinforces the emerging bearish trend.
Identifying Support Levels: Recognizing key support levels near the Tweezer Tops on the price chart can provide added conviction in the impending bearish reversal.
Incorporating Oscillators: Technical oscillators like the Relative Strength Index (RSI) or the Moving Average Convergence Divergence (MACD) can complement Tweezer Tops analysis and help substantiate the onset of bearish momentum.
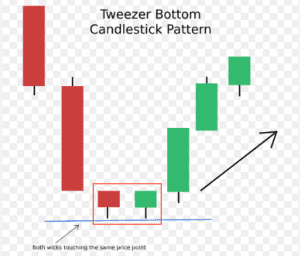
Tweezer Bottoms:
The Tweezer Bottoms candlestick pattern is a fundamental element of technical analysis, renowned for its potential to indicate an impending bullish reversal in financial markets. This two-candle pattern is characterized by matching lows, emphasizing a crucial support level and a shift from a bearish to a bullish trend.
To fully appreciate the significance of the Tweezer Bottoms candlestick pattern, it is essential to delve into its defining attributes, comprehend its implications, and learn how to effectively interpret it when it materializes on a price chart.
Key Characteristics of the Tweezer Bottoms:
Two Matching Lows: The Tweezer Bottoms pattern consists of two candlesticks with identical or nearly identical lows, establishing a strong support level. The first candlestick is generally bearish, followed by a second bullish one. Both candles touch the same price point, emphasizing a critical level where the price found support.
Divergent Real Bodies: While the lows are at the same level, the real bodies of the two candles exhibit opposing characteristics. The first candle is bearish, reflecting downward momentum, while the second candle is bullish, signalling a reversal.
Interpreting the Tweezer Bottoms:
The Tweezer Bottoms candlestick pattern is highly regarded for its potential to serve as a bullish reversal signal, particularly when it appears after a prolonged downtrend. Here’s how to interpret the Tweezer Bottoms pattern:
Bullish Reversal Indication: When Tweezer Bottoms materialize following a substantial downtrend, they communicate a possible shift from a bearish to a bullish trend. The pattern underscores the establishment of robust support at the matching lows, effectively preventing further downward movement.
Market Transition and Emerging Bullish Sentiment: The Tweezer Bottoms pattern signifies a transition from a bearish market to a more bullish one. The support found at the identical lows highlights a balance between buyers and sellers, ultimately leading to a bullish sentiment.
Confirmation for Enhanced Reliability: Traders often seek confirmation through subsequent price action to strengthen the Tweezer Bottoms’ bullish reversal signal. Additional bullish candlesticks or technical indicators can enhance the pattern’s reliability.
Read Also: Smart Money Concept Trading for Beginners: Learn How the Banks Trade
Tweezer Bottoms Trading Strategies:
To optimize the Tweezer Bottoms pattern in their trading decisions, traders apply various strategies:
Confirmation with Subsequent Candlesticks: Traders look for validation through one or more bullish candlesticks following the Tweezer Bottoms. Such confirmation reinforces the emerging bullish trend.
Identification of Resistance Levels: Recognizing key resistance levels near the Tweezer Bottoms on the price chart can provide added conviction in the impending bullish reversal.
Incorporating Oscillators: Technical oscillators like the Relative Strength Index (RSI) or the Moving Average Convergence Divergence (MACD) can complement Tweezer Bottoms analysis and help substantiate the onset of bullish momentum.
⇓ Candlestick Patterns PDF Download Here ⇓
Conclusion:
These are just a selection of the many candlestick patterns available for technical analysis. Each pattern provides unique insights into potential price movements, and traders often use a combination of them along with other indicators for more accurate predictions.
In this article, I have been able to compile 24 candlestick patterns with detailed explanations for each. These patterns can provide valuable insights into market sentiment and help traders make informed decisions. Ensure you properly study and understand each candlestick’s characteristics.
If you found value in this article, kindly leave a like comment and also share, so more people can get a deeper understanding of candlestick patterns.
Finally, if you have found some value in this article, Kindly click on the Ad click button below, as you will be assisting us in making some little funds to help keep the platform running. Thanks
See other PDF Articles
- The Best Day Trading Strategy PDF Guide in 2024
- Taking Profitable Trades Using Trading Chart Patterns PDF Guide
- The Best Price Action Trading PDF Guide For Beginners
- Smart Money Concept Trading PDF
Are you interested in joining a community where you can learn all you want to know about the cryptocurrency space, defi, web3, and forex trading and also have access to live AMA sessions from time to time, then click the button below to join Dipprofit Telegram Community For Free Now.


