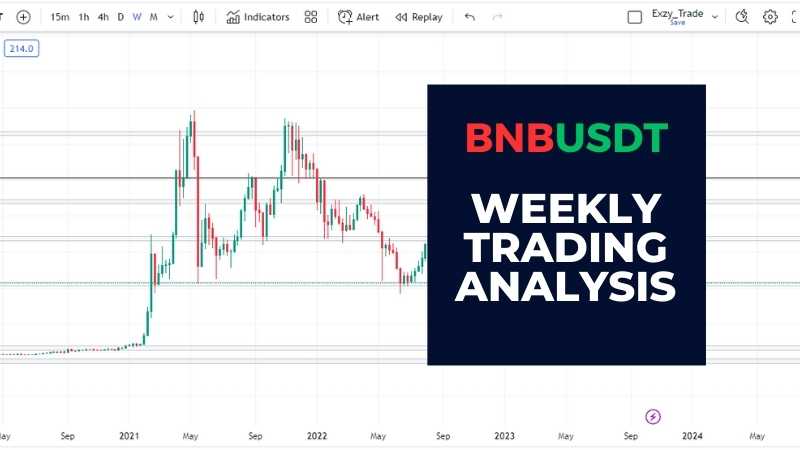
BNBUSDT Free market analysis for week 42 (16 Oct 2023)
This week’s free market analysis on crypto is on BNBUSDT.
MONTHLY TIMEFRAME

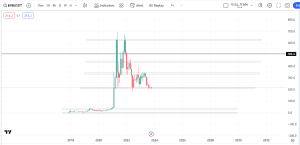
BNBUSDT on a monthly timeframe, is on a downtrend, and it has been making a series of lower lows and lower highs. Price has been trading and respecting key levels and is currently trading on a significant support level.
WEEKLY TIMEFRAME

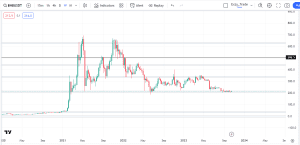
BNBUSDT, on the weekly timeframe, has been on a downtrend and has also been respecting key levels, but currently, the price seems to be stuck and trading in a range with support at the $210 price level and resistance at the $337 price level and the price is trading at the support zone.
See also: ETHUSDT Free market analysis for week 41
DAILY TIMEFRAME

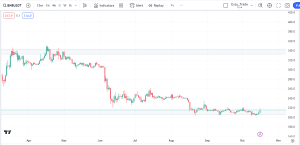
BNBUSDT, on the daily timeframe, has been making a series of lower lows and lower highs and the price traded from resistance after making multiple touches at that level till it has gotten to the support zone. It is currently trading at the support zone, and it has not broken it.
4 HOURS TIMEFRAME

BNBUSDT, in the 4-hour timeframe, is currently trading at the major support zone, and it has been trading in a range with resistance at the $219 price level and support at the $205 price level. Price is currently trading bullish after its bearish movement and tried breaking the support zone, which it didn’t.
PRICE PROJECTION:
BNBUSDT is in overall down trend and we will be taking a short position, our entry confirmation will be on the break below the major support and the break below the swing low, we will only enter this if it breaks and retrace to that major key level(to mitigate the liquidity and gain momentum to rally down).
CONCLUSION
This free market analysis is not a guarantee for profitability while trading the BTCUSDT pair, but the author’s professional opinion. We therefore advise the reader to use the free market analysis as a guide while carrying out their individual analysis.


