The Secret to Profitable Forex Trading: Trendlines and Channels
Trendlines and channels are some of the most effective tools that improve the chances of profitable forex trading for forex traders. In this article, I would be helping you understand the proper way of using this trading strategy to increase your chances of profitability in Forex.
The trendline is a line that is drawn on a forex, commodity, currency, binary, or index chart and is used to determine trends in the market. The line is drawn through the lowest and highest price points represented on the chart.
Trendline helps the trader easily determine the market direction and see a clearer picture of the price action, this in turn helps in speculating the future price movement of whatever instrument the trader is analyzing.
Furthermore, the trend line is one of the most commonly used strategies in technical analysis as it is a very effective strategy for trading the stock, index, and commodity market. In fact, it is important that every aspiring trader understands how trend line strategy works and how to apply it while trading.
Trendlines also give a clearer picture of the market condition and help for easy interpretation of the market price.
Trendlines also help in determining resistance and support levels, entry and exit levels, and breakout and breakdown levels, this in turn makes trading easier.
One very peculiar thing about the stock and forex market is the fact that the price of an instrument cannot keep going in one direction infinitely. There would also be times when prices would be Bullish and other times when price becomes Bearish, this is because the market is highly volatile.
The highs and lows in the price movement keep happening at different intervals, making the market seem confusing, this is where the trend line comes in handy as it can be used cleanly to filter out the noise and through the lines drawn to connect the high and low points in the market and help the trader understand the general direction, the market price is tending towards.
Uptrend line:
In the uptrend market, the line is drawn and used in connecting the market price low points, while the line is drawn in an upward direction.
What this means is that the lowest point where the trend line started should be the lowest point in the uptrend line as the Bears in this situation gets weaker and are unable to push the price lower than the previous low price level, then we begin to see higher lows and higher high.
Once this starts happening it means the Bulls are getting stronger, gaining more momentum, and pushing prices to higher levels.
Down trendline:
This is the opposite of an uptrend as here we have lower highs and lower lows, the trend line is drawn from the highest price point to the lowest point of the market as the highest points after the first point keeps decreasing or getting lower, descending to the lowest price level where the bulls have completely lost their dominance in the market.
In order to draw a more accurate and reliable trend line it is expected that the low and high points must be a minimum of 3, the smaller the number of lower lows or higher highs and vice versa, the less accurate and less reliable the trendline becomes.
There are several forms of Trend lines such as Linear, Exponential, Polynomial, Moving Average, or Logarithmic. The most commonly used one is the Linear Trend line.
Read Also: How to Trade Like a Pro Using SMC Trading Strategy
How To Use Trendlines For Trade?
If the market is in an uptrend movement, the trader would then begin to look for opportunities to enter a buy trade, as the trader has been able to use the trend line to determine the direction of the market.
While in a downtrend market, the trader searched for opportunities to enter a sell position, since it has been determined that the market is moving downwards.
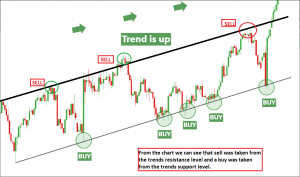
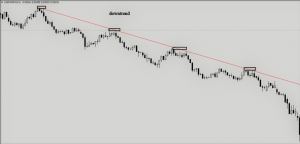
Below is an example of both a downtrend and an uptrend market determined by the trendline.
Uptrend Market chart
Diagram 1
Downtrend market chart
Diagram 2
After drawing the trend line and determining the general market trend, as stated already the trader starts looking for buy opportunities in the uptrend market and sell opportunities in the downtrend market.
Searching for entry points, Stop Loss and Take profit points can also be determined using the trendlines.
It should also be noted that the trendlines themselves form Resistance and support levels.
In trending markets, there are always pullbacks which are when the market goes against the trend for a while before continuing in the direction of the trend, at this point, if it’s in an uptrend market like the diagram 1 above, the trader would wait for a little sell to the higher low point in the trend line which at this point is serving as a support zone in the market before taking a buy trade continuing the trend.
If it’s a sell trade, the trader would wait for the price to go in the opposite direction of the downtrend as we can see in diagram 2, once it hits the resistance level in the trend line, the trader waits for confirmation, which can be in form of candlestick patterns like the engulfing pattern or the Doji, before taking a sell trade to continue the trend.
Another way to trade using trend lines is to wait for a breakout from the channel in which the upper and lower channel has formed. In an uptrend channel, a real breakout from the resistance zone would mean a bullish surge in price, which creates another opportunity to make great profits.
Channels
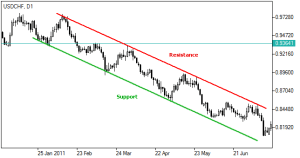
A forex trading channel is a trend-following tool that shows the range of price movement. Channels are formed by connecting two parallel trend lines that act as support and resistance levels. The lower trend line represents the support level, while the upper trend line represents the resistance level. The price movement within the channel is considered to be a trend, and traders use this information to identify potential trade opportunities. There must be a minimum of 3 points at the lower line and the upper line to be able to determine a channel.
How are Channels Formed in Forex Trading?
Image Credit: ifcmarkets
Channels are formed by identifying two or more highs or lows in price movement and connecting them with a trend line. The trend line acts as a boundary for price movement and helps traders visualize the range of price movement. To form a valid channel, the price should touch the trend line at least two times, creating a pattern of higher lows or lower highs.
Using Channels to Identify Trade Opportunities
One of the main advantages of using channels in forex trading is the ability to identify trade opportunities. By understanding the range of price movement, traders can determine where to enter and exit trades.
For example, if the price is approaching the upper trend line, it may be a good time to sell, as the price may soon experience resistance and potentially drop. On the other hand, if the price is approaching the lower trend line, it may be a good time to buy, as the price may soon experience support and potentially rise.
Note: When the price breaks through a channel the movement is always stronger than when the price was within the channel. This is because breaking a channel requires a massive market momentum in a particular direction.
When Price is trading within a channel it means there is a constant and almost equal struggle between the bears and the bulls. But the moment the price breaks out of the channel, it means, either the bears or the bulls have become dominant in the market, and they would drive the market in their direction.
In conclusion, trendlines and channels are very effective and important tools for technical analysis, as they help remove the noise from the charts and make reading, analyzing, and speculating easy.


Comments 1