Using Technical Indicators for Proper Technical analysis
Technical analysis is one of the most important skills that every Forex trader requires for profitable forex trading and to have a successful forex trading career. While some traders are naturally adept at analyzing economic and mathematical data, most require lots of practice before they become proficient at this ability.
Even fast learners might need considerable practice before being able to quickly and accurately chart the data and interpret what it all means.
Over the years, trading experts have developed numerous quantity of tools for plotting, computing, and analyzing various data relevant to Forex trading. These tools are what we have come to know as technical indicators.
Forex traders and investors use these technical indicators to carry out a technical analysis which is simply the process of studying past data and ongoing trends in order to predict future patterns in price movements. T
he outcomes from the analysis allow the investor to make the right trade decisions. As a trader, it is important for you to learn how to use these indicators to boost your Forex profits.
It is crucial that you choose the right set of technical indicators that are most suitable for your particular trading style. While it is useful to know many different tools, it would be a waste of time to consult too many of them for each trade that you make.
Thus, you should keep the arsenal of your technical indicators to just the most useful and important ones. Below are some of the more popular technical indicators that Forex traders use these days.
Basic Indicators Used for Technical Analysis
Moving Averages
The moving average is one of the main indicators used for technical analysis in forex trading. It is important for Forex traders to be aware of the average rates of currencies over a specific time range.
When plotted against the price action, it will be easy to follow the trend and thus make better trade decisions. A specific type of this indicator is the MACD (Moving Average Convergence Divergence).
The typical way of using a moving average indicator is to pinpoint where a trend might lose momentum and move in a different direction. Such points make for good opportunities to create trade positions.
Historical Volatility
Past data is a very valuable element in technical analysis Traders often examine historical volatility during certain periods to identify the coming trends during similar market situations. They do this by computing the standard deviation of the rate changes for a particular period.
The practical use of historical volatility in Forex trading is for the risk assessment for various currency pairs. With this information, it becomes easier to determine the size of the trade position that you want to make at any given time period. Indicators that measure volatility work perfectly for a fast-paced trading strategy that aims for frequent profits with shorter positions.
Relative Strength Index (RSI)
The RSI is another effective indicator used for technical analysis. The RSI is used for identifying overbought and oversold conditions in the forex market. The RSI is a momentum oscillator that was developed by J. Welles Wilder. It returns values from 0 to 100 that corresponds to the strength and rate of movements in the market.
A number that is less than 30 indicates an oversold market condition. While a number that is higher than 70 indicates that the market is overbought.
The RSI indicator is also a good tool for determining divergence against price action. Such divergence can signify an imminent reversal of the market direction.
Bollinger Bands
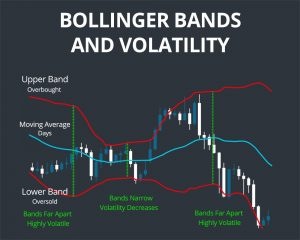
This is another tool used for technical analysis and it involves the volatility of the chosen currencies. The Bollinger Bands are made up of multiple lines that pertain to different values in the market. The middle line represents the moving average while the two remaining lines above and below this central line denote the standard deviations around the simple average.
These bands are superimposed on the price movements of the market over a specified time period. When the market rises above the upper line, it is usually a signal for traders to sell. Conversely, when the market goes below the lower line, it is usually a signal to buy.
Oscillators
These are tools that traders used to identify conditions in the Forex market that are overbought or oversold. It is also a good indicator of price momentum.
One of the more widely used of this kind of technical indicators is the Stochastics Oscillator. This tool shows that when the trend of the currency prices is going up.
It also shows the closing prices that will usually be in the upper range. Likewise, when the trend is going down, closing prices will typically be in the lower range for the day’s average.\
On Balance Volume (OBV)
This indicator is often used by more experienced traders for the confirmation of results derived from simpler technical tools. The OBV indicator is a very great tool for technical analysis as it shows the trading volume information for the different currency pairs. If another tool you are using indicates that there is a price breakout. For instance, you can use the OBV indicator to verify this before you decide on your next trade position.
Basically, what the OBV indicator does is examine the exchange rate performance of a particular currency. Then designate a positive sign or a negative sign on the trading volume information. This sign will occasionally change, denoting a potential market reversal.
Any trader can have access to these tools. But you will usually have to do all the actual analysis of the data.
There are also commercially available indicators that you can purchase, which are also known as black box systems. These are more convenient to use because all you basically have to do is input the data and the program will do the analysis for you. But the drawback is that you cannot customize the method to meet your personal needs and preferences.
Sometimes, the more serious traders even create their own technical indicators, usually with the help of hired programmers.
Guidelines that can help in using a technical indicator effectively.
It can be rather overwhelming when you are just about to start using indicators, especially if you have no experience with such tools before. The technical analysis in itself can be pretty daunting, plus learning how to use the tool itself can add to the confusion. It’s not very difficult though once you get the hang of it. To help make the experience easier, here are a few things that you might want to keep in mind when using indicators.
Keep them to a minimum
As mentioned earlier, it is a good idea to use only the technical indicators that you really need. There is such a thing in the Forex trading industry known as analysis paralysis. It means that the more you analyze, the more you are unable to make a decision on what trades to make.
Many traders make the mistake of using too many tools because they want to make sure of a signal before making a move.
Oftentimes, though, this is not practical because the prices in the Forex market change very quickly. You have to make your decisions quickly and usually do not have time to consult so many complicated analytical tools.
Use indicators of different types
Using too many indicators may not be a good idea, but using just a single one is not advisable either. It is best to use multiple indicators that are of different types. If you use too many indicators of the same category, like moving averages, it will only give you the same results with the same data.
On the other hand, if you use different types of indicators, you can get a variety of information from the same data, allowing you to make better trade decisions. Pick indicators that complement each other, or that can confirm the accuracy of each other.
For instance, you might be using a moving average indicator to track price movements. You can then verify the signals that the moving average indicator gives you by applying the Relative Strength Index, which is classified as a momentum indicator.
Let your trading strategy be your guide
In the process of your technical analysis, the type of indicators that you need will generally depend on the trading strategy that you are using. For example, if you are following a price action strategy, a moving average crossover can be a good indicator to use. F
or range trading, you can benefit from oscillators to time your entry and exit points. The RSI and the Stochastics oscillator are among the excellent tools you can use. For scalpers, a moving average indicator works well to confirm price trends, while an oscillator like the RSI helps a lot in scalping within shorter time periods.
In general, if you prefer to use a trading strategy with long-term positions, you will be focusing on the following trends. Hence, you should focus on indicators that follow trends, like the moving average.
If you prefer a strategy that uses short-term positions and offers more frequent but smaller profits, you should use indicators that take a look at volatility.
There are also times when your strategy might also change depending on the technical indicators that you use.
In any case, you shouldn’t hesitate to experiment with different indicators and different strategies until you find the trading style that is perfect for you.


